

For asset owners, understanding the level of risk in their portfolios is critical to both capital preservation and maximising returns.
While multi-asset class portfolios may appear diversified along set allocation targets, asset owners may be unwittingly exposing their portfolio to extensive systematic risk that could lead to uncomfortable capital losses.
Analysing a portfolio based on risk factors offers asset owners a new perspective and can reveal where they may be taking on too much, or too little risk. In this blog, we demystify fundamental factor models so asset owners can gain a deeper understanding of how multi-asset portfolio risk can be decomposed, helping you identify hidden and unintended risk hotspots.
Repricing vs Factor Models
Firstly, there are two ways that risk can be decomposed. One is with repricing models, where you calibrate each position and provide the pricing of each position into the model, which gives you the sensitivities to that particular asset. For example, if you were to model an equity option, you would look at pricing mechanisms or do a binomial strep tree. These models are particularly useful for portfolios that contain derivatives and other instruments with non-linear payoffs.
The other way of looking at risk is through factor models, which consider the key risk factors each of these positions is exposed to, offering insights into what is driving sensitivities, exposures, and other risk analytics. Factor models are better suited to multi-asset portfolios, including those with private equity and hedge funds.

Repricing vs Fundamental Factor Models
The three types of multi-factor model
There are three types of factor models, each providing a different lens from which to look at the risk drivers within your portfolio:
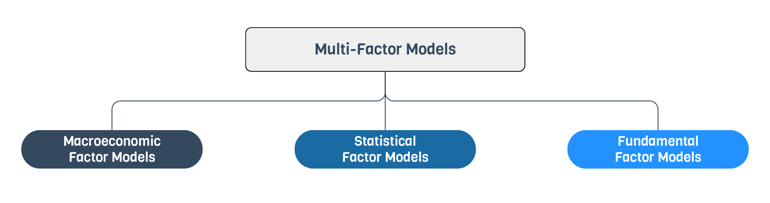
The three multi-factor models
1. Macroeconomic models
These models look at your portfolio in terms of looking at macroeconomic factors such as inflation, unemployment rates and GDP growth. Although this lens is suitable for looking at market relationships, it is less suitable for assessing economic risk and the standalone asset risk of holdings within your portfolio.
2. Statistical models
These models are statistically and computationally intensive, aiming to identify the drivers of volatility within your portfolio at any point in time. They give you factors that explain volatility and historical volatility and try to back test it in a statistical way.
But even with this additional layer of risk driver identification, they may not provide an intuitive understanding of the factors driving risk at the asset level. Considerations such as how that asset is broken down into specific factors, how to interpret those numbers, and then how then to further use those numbers for risk budgeting and risk mitigation purposes. This is where fundamental factors come into play.
3. Fundamental factor models
Fundamental factor models look at your portfolio, which could be multi-asset class and span thousands of positions, and simplify that portfolio by giving you deep insights into the key fundamental risk drivers within it.
These models look at a specific asset type by breaking down its risk in an intuitive way that can be easily interpreted and understand by all key investment stakeholders. They combine all the positions that you have within the book so that you can simplify your entire portfolio to a few key factors that are driving your asset class risk and returns.
Equity-based models
Fundamental factor models have their roots deeply embedded in the equity asset class, serving as the backbone for investment strategies such as value investing and momentum investing.
Taking the example of an Apple stock, let’s explore how a fundamental factor model approach dissects its risk profile. In terms of hierarchy, it would first look at the market risk of that position. Each equity position would have sensitivity towards market movements and cyclical movements.
At the second level, the analysis progresses to the country and the industry-level risk coming from that position. For a company like Apple, which predominantly operates in the IT or consumer electronics sectors, this level of analysis helps to uncover the additional risks stemming from its industry’s performance and how specific countries’ economic conditions affect the stock. This nuanced approach allows investors to grasp how Apple’s returns have historically correlated with broader industry and country-specific trends, providing insight into the stock’s historical volatility.
At the third level, the model then delves into asset-specific and fundamental characteristics, such as valuation metrics (over or undervalued status based on value factors, earnings certainty, and accrued income. This examination of quality and growth factors further refines the risk profile by evaluating Apple’s projected earnings in the short to medium term
Finally, it's imperative to consider the currency risk which, although not part of the hierarchy, remains a vital consideration for any assets held in a currency different from the portfolio’s base currency. This acknowledgement ensures that investors account for the potential impact of currency fluctuations on their international holdings.
Managing factor risk in an equity book
When evaluating publicly listed equities through factors, it is important to compare it against a suitable benchmark, such as the MSCI World for a global portfolio or the S&P 500 for a U.S.-focused strategy. This benchmarking is essential to understanding how an equity portfolio’s risk aligns with broader market trends.
A high-level portfolio risk report produced with MSCI BarraOne
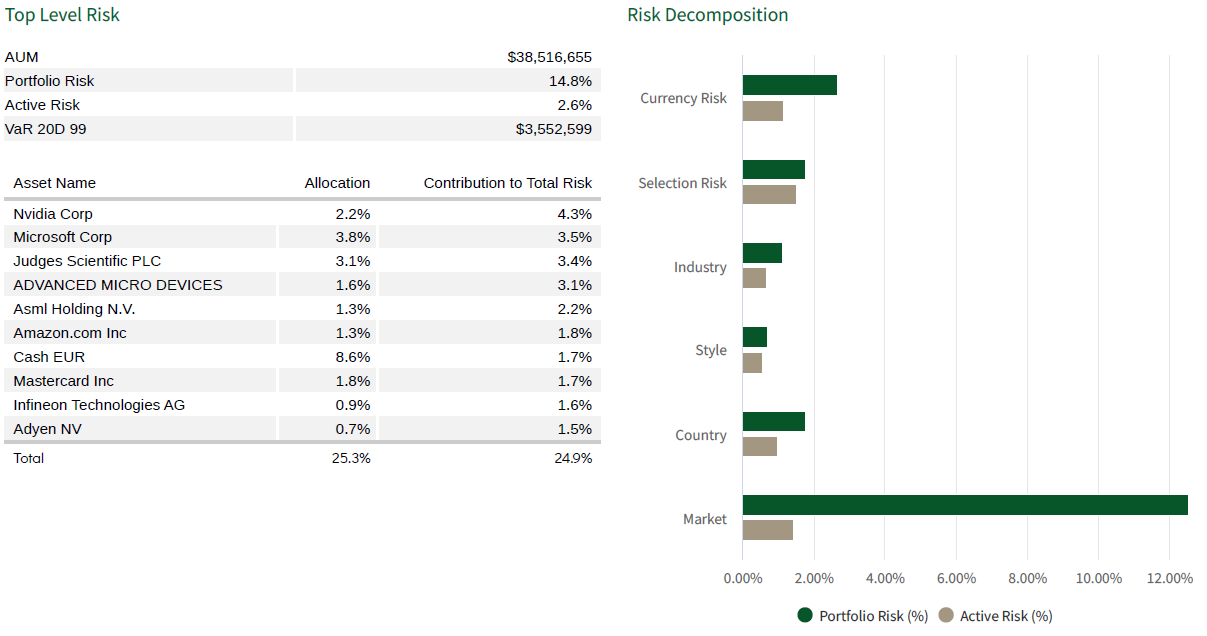
Here is an example of a factor analysis produced in Sesame to help identify risks in a portfolio of equities. This is a $38M equity-only book that was being managed across multiple managers and strategies. They had a US-specific strategy, a European growth-based strategy, and an emerging markets strategy. So, we consolidated all of this and combined this together to look at the total risk of the book itself.
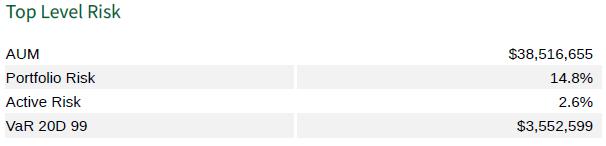
Key metrics regarding portfolio risk
This portfolio presents a risk of 14.8%, closely aligning with the 15% historical volatility of the MSCI World Index. With an active risk of 2.6%, this figure is your tracking error and shows your deviation in comparison to the benchmark. This relatively low figure suggests that despite the strategy diversification, the aggregated risk mirrors that of a conventional global equity portfolio.
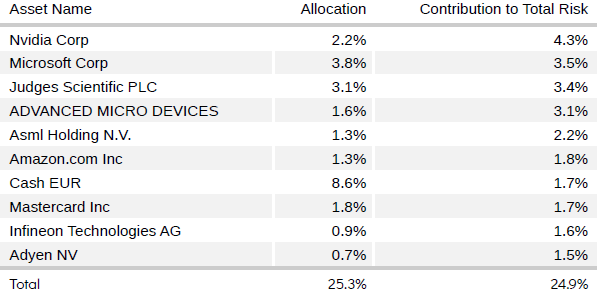
Top 10 contributors to portfolio risk
Looking at the top positions contributing to the total risk of the book itself, you can see that most of its positions are in large cap US and global stocks, expected in a portfolio exhibiting a low tracking error. This observation underscores the importance of scrutinising individual holdings to assess their impact on the portfolio’s overall risk profile.
Using factors to identify style bias
For equity-only strategies, style factors are crucial for understanding the unintentional biases that you are holding and confirming intentional biases. When allocators chose active strategies, unintentional biases may emerge over time. For example, investing too much in large cap or small cap stocks, or developing an overexposure to value or momentum stocks.
The way to uncover these is by identifying your standard deviations against a mean, where the mean represents your chosen benchmark, and comparing your portfolio and active exposures in relation to the benchmark.
Using factors to identify unjustified fees
After performing such analysis on your own equity book, you may find that it tracks closely to your chosen index, both in terms of risk and return. This may prompt a reassessment of the value derived from active management fees. In such cases, a shift towards lower-cost, passive ETFs could offer a more efficient capital allocation strategy to achieve a similar risk profile.
Multi-asset fundamental factor models
The MSCI Multi-Asset Class Factor Model
Fundamental factor models, such as MSCI BarraOne, have a multi-asset class model, which delivers a comprehensive approach to factor modelling across a diverse range of asset classes, including private equity, hedge funds, private infrastructure assets, real estate, and listed assets such as bonds, liquid options, and futures. With multi-asset models, further factors need to be incorporated, beyond what is available in equity-only models.
In the realm of fixed income, such as corporate bonds, there are at least two risk sources. One is your sensitivity to risk-free rate movement. With a dollar denominated bond, if US treasuries move, returns of that asset would also move. It is also driven by a term structure factor, and then it would have a spread risk. That issue would have credit risk on it, which is that it can default. So based on that, spread movement would also be driving the returns of that asset class as well. So naturally you would have a spread factor.
Options introduce another layer of complexity, with multi-asset models examining underlying risk drivers of the option itself. If it is an equity option, for instance, it would look at all the equity factors and show an implied volatility factor.
Private equity risk modelling
The modelling of private assets typically follows one of two approaches, each with its own benefits and drawbacks.
1) Assigning private assets a proxy public position
For example, with a distressed PE fund, you could assign a proxy to a high yield index. Or if it is a late-stage venture fund, you could assign a small cap sector-specific index as a proxy. This would enable you to understand your risk based on these index positions, with high-frequency underlying data. The drawback of this approach is that you are not capturing data that is private market specific, or the liquidity risk of privately held positions.
2) Analysing private equity data
The second approach is to look at the actual private equity data. Here, you look at the actual transactions that have occurred for the private assets themselves. The challenge is that this is low frequency data and usually the returns are not realised until you exit the investment, particularly for private equity.
This method tends to underestimate systematic risk. Because the returns are smoothed for these assets, you will see low volatility, low beta, and low cyclical sensitivity.
Fundamental factor models like MSCI BarraOne address these challenges by amalgamating the strength of both approaches. It begins by assigning a public proxy based on the strategy of the position itself. Then for sources of risk, which are coming from illiquidity and market inefficiencies in the private markets, it layers an additional factor on top, which accounts for the additional sensitivity that is coming from these factors.
Across various private equity strategies, it has the return history across regions, strategies, asset classes, which are used to build the factor and then look at the sensitivity of the extra returns being explained by having taken more illiquid positions and taking risk in positions that are more inefficient in nature. With access to private equity return histories across regions, strategies, and asset classes, MSCI BarraOne builds a robust factor framework that accurately reflects the additional risks and returns associated with more illiquid and inefficient positions.
Modelling Composite and Index positions
One of the biggest advantages of employing fundamental factor models like MSCI BarraOne lies in their capability to tap into an extensive database of constituent fund data. This database includes an array of listed funds, ETFs, and index positions.
When evaluating factor exposures, particularly for holdings in broad market instruments such as an S&P 500 ETF, MSCI BarraOne does not confine its analysis to a singular industry or country; instead, it offers a multi-faceted view that spans multiple industries, countries, styles, and strategies.
Identify and manage your risk exposures within Sesame
The portfolios of asset owners are more complex than ever. Despite looking diversified across multiple asset classes that, while outwardly diversified, may harbour unseen systematic risks. These risks can inadvertently subject asset owners to significant potential losses, underlining the necessity for risk management solutions.
Landytech’s platform, Sesame, provides cost-effective access to MSCI BarraOne, in an intuitive and user-friendly front-end experience, with multiple views of portfolio exposures including:
- Ex-ante Barra factor risk
- Full-revaluation stress testing
- Value at Risk (VaR) simulations
- Traditional exposures and sensitivities.
Put the insights from this article into practice. Discover the capabilities of Sesame and how its native integrations with institutional-grade risk platforms are enabling asset owners to achieve total portfolio control.


