Group by anything
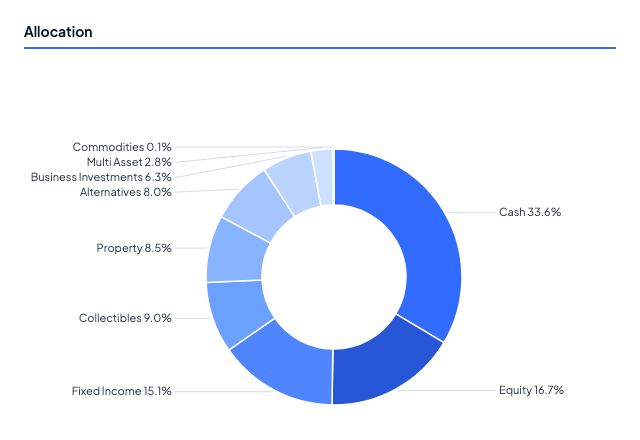
Contribution and attribution by sector, region, asset class, currency or entity.
Understand what is driving your portfolio, not just where it stands.
Inform decision making across your entire portfolio with full drill-down flexibility across performance, risk, liquidity, exposure and forecast metrics.
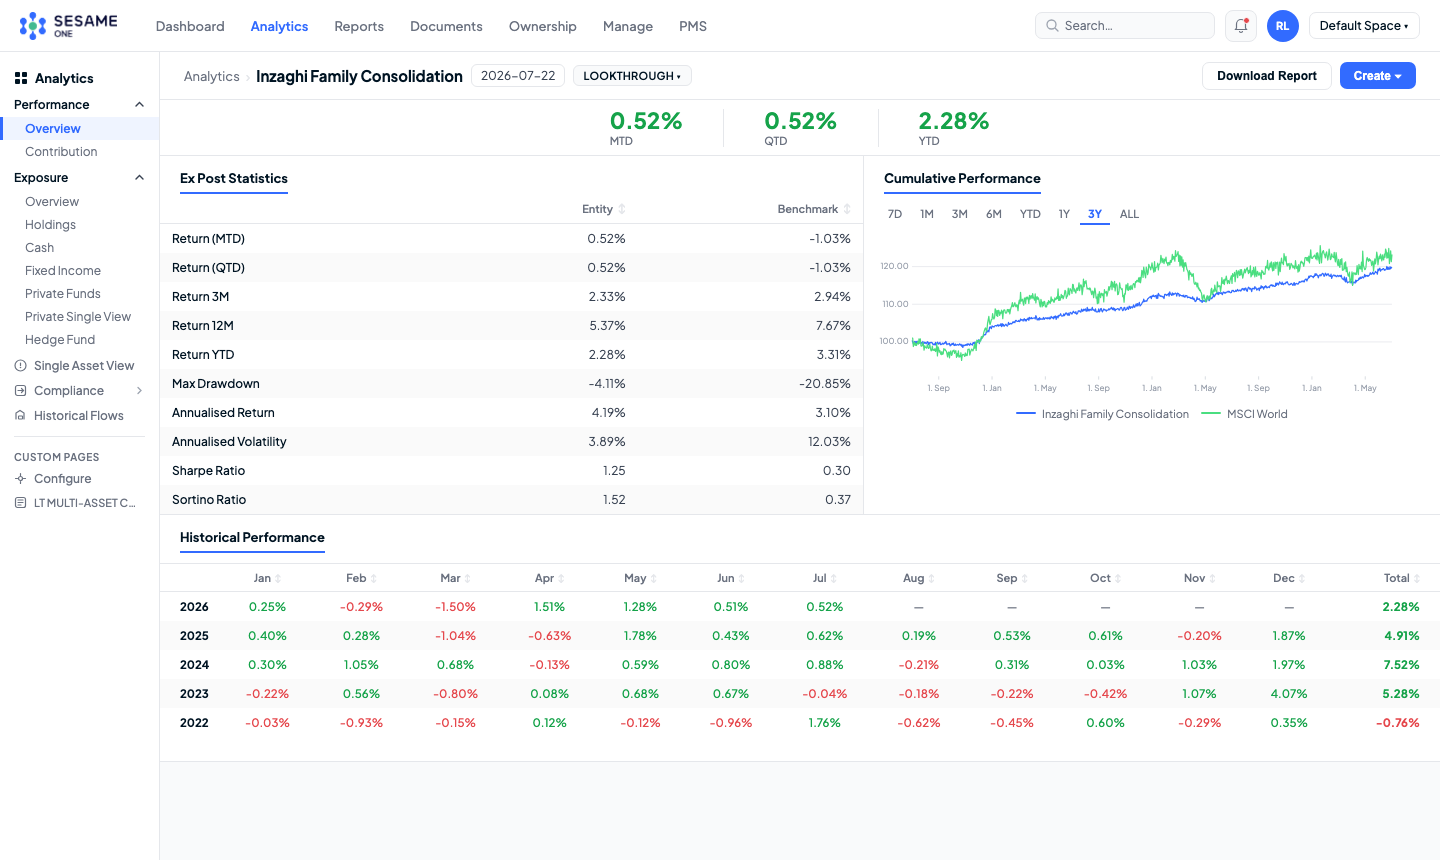
Performance, exposure, risk and cash flow, all computed on the same consolidated dataset.
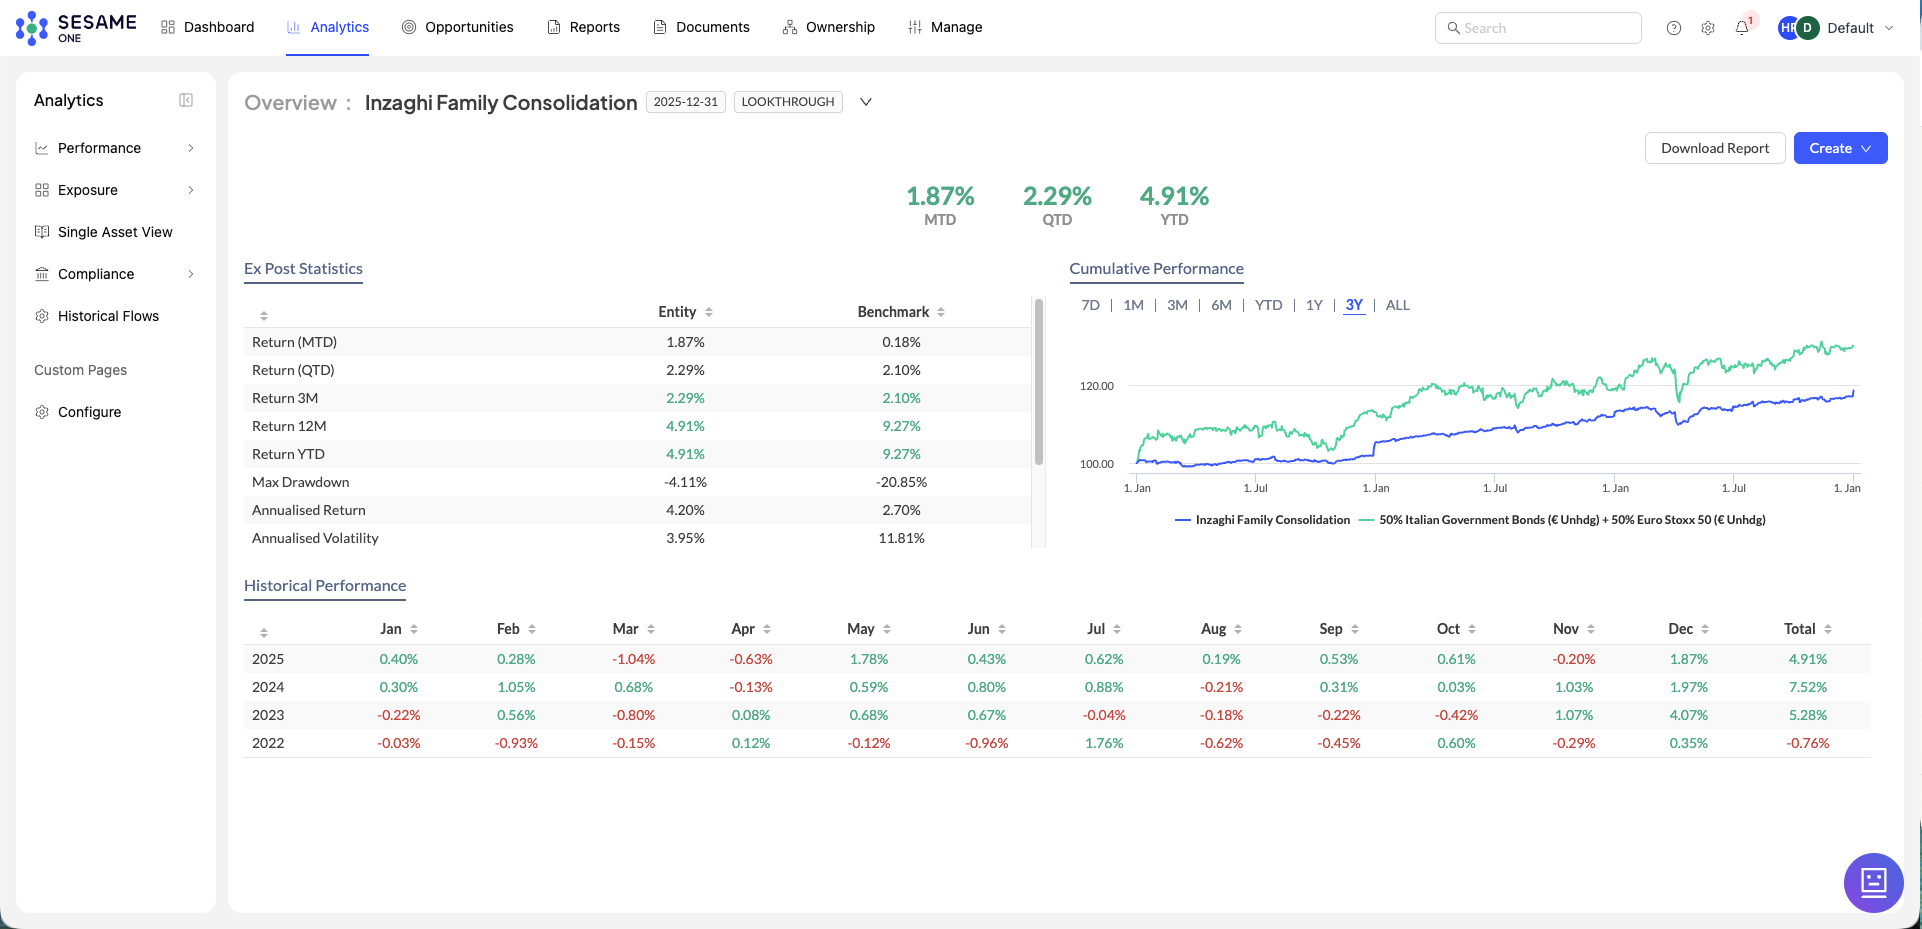
Understand the drivers and detractors of performance, with contribution by any grouping and Brinson attribution to separate allocation from security selection.

Analytics · Performance
Inzaghi Family Consolidation
Outcome: answers you can defend in an investment committee.
Contribution and attribution by sector, region, asset class, currency or entity.
Every statistic you need to monitor performance over multiple time intervals.
Historical and user-defined stress testing, shocking any factor relevant to you.
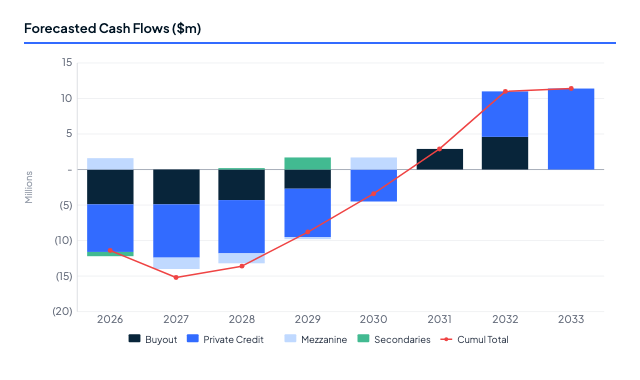
Cash flow projections built from your income, expenditure and commitments.
Sesame has allowed our team to understand in-depth portfolios’ risk and performance by security, industry and numerous other factors. The analytical engine of the software is very robust, yet the product is easy to use.
Sesame pairs MSCI BarraOne and RiskMetrics with configurable reporting, so you can understand portfolio risk in real depth:
Identify and manage the underlying factors driving your portfolio risk.
Parametric, historical simulation and Monte-Carlo VaR, with position and portfolio sensitivities.
Historical and user-defined scenarios, shocking any risk factor relevant to your portfolio.
Landytech is ISO 27001 and SOC II certified. Each client has its own physically isolated database, so you can feel confident every byte of your data remains secure.
Explore the Landytech Trust Centre.png)


See the analytics running on your own portfolio data.
~30 min personalised session. No commitment.